
Portfolio Performance - Jun'26
Jun'26: ~8.0% annualized alpha, Sortino ~2.0, IR 0.69, low max drawdowns. Live, real-money portfolio.

Portfolio context is detailed in the About page.
Performance metrics here are for the 1 Jul'24 to 30 Apr'26 time period.
Summary
Monthly performance dashboard


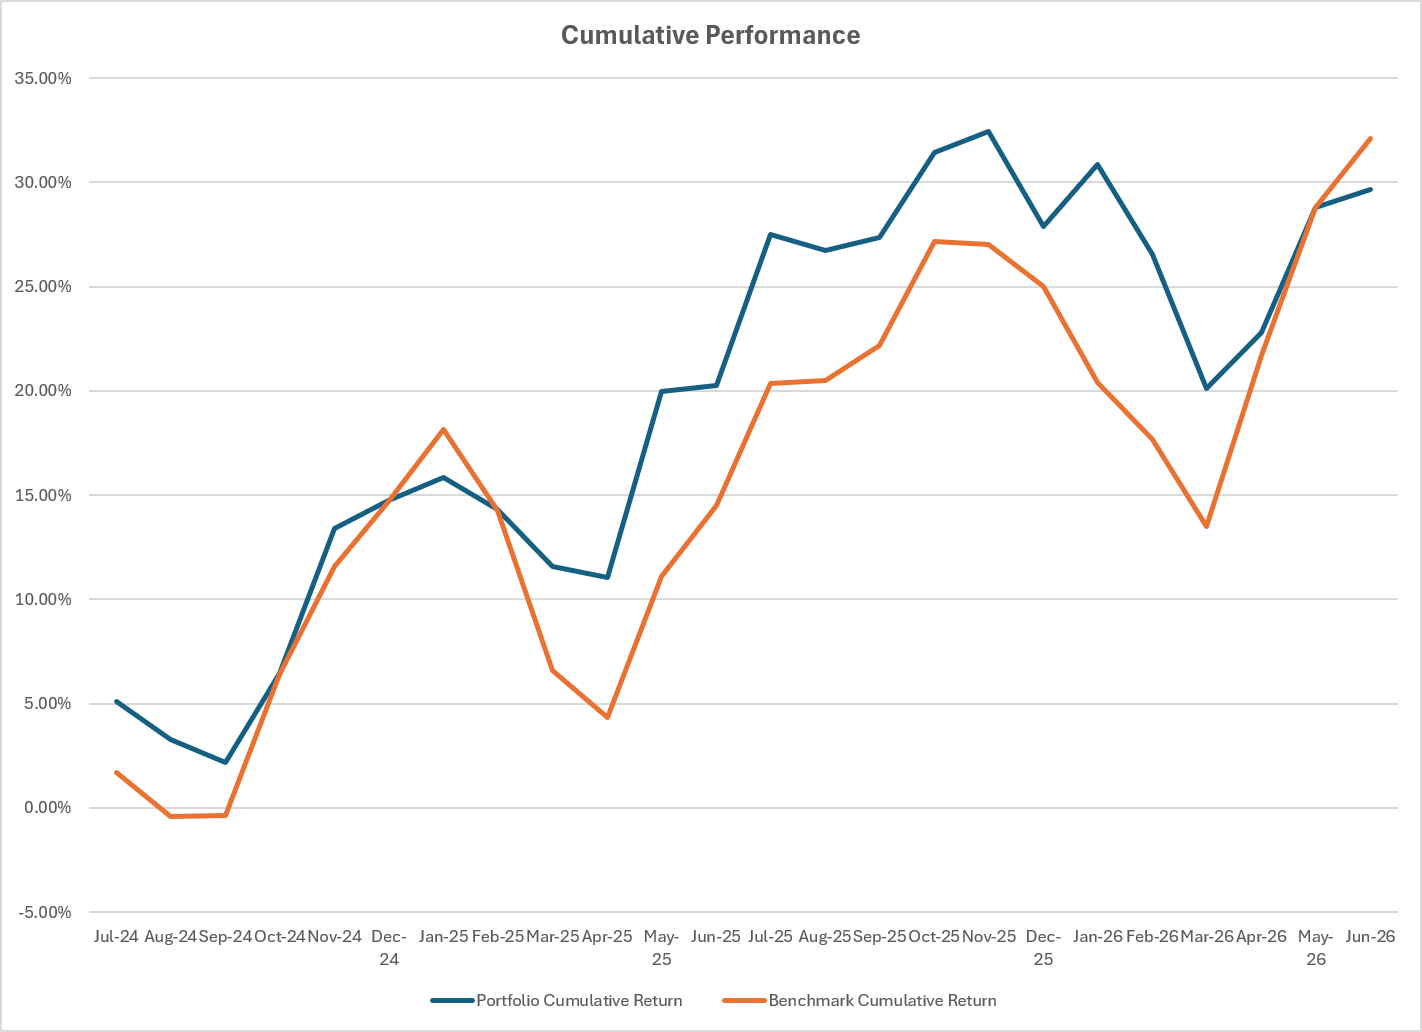
Strong risk-adjusted performance metrics
- Daily/weekly Sharpe: 0.88/1.11, assuming 0% risk-free or hurdle rate.
- Daily/weekly Sortino: 1.10/1.97, assuming 0% risk-free or hurdle rate.
- Daily/weekly annualized alpha: of 8.2%/8.0% vs SPY AUD benchmark.
Value addition measures are high.
Results are based on a very large, diverse sample size
- Average of 137 tickers bet on over 24 months.
- Aggregate returns profile is made up of many contributions of small positions rather than a reliance on a few concentrated winners.
Diverse sources of returns reduces dependency on favorable market regimes.
Minimal catastrophic tail risk and scalable
- Long-only, zero leverage strategy investing in global stocks and related traditional ETFs without any inverse, ETN or other derivative exposures in mostly Developed markets.
- Positive skew in both overall portfolio and ticker-level return, contribution to return distributions.
- Low max drawdowns, low beta, upside to downside capture ratio of almost 2x based on daily returns.
- Market impact analysis suggests this portfolio is largely scalable to >USD 100M AUM.
The strategy is suitable to manage a large amount of capital in order to grow wealth over a long period of time with dramatically reduced volatility along the way.
Performance vs SPY AUD
Portfolio (AUD) vs SPY AUD
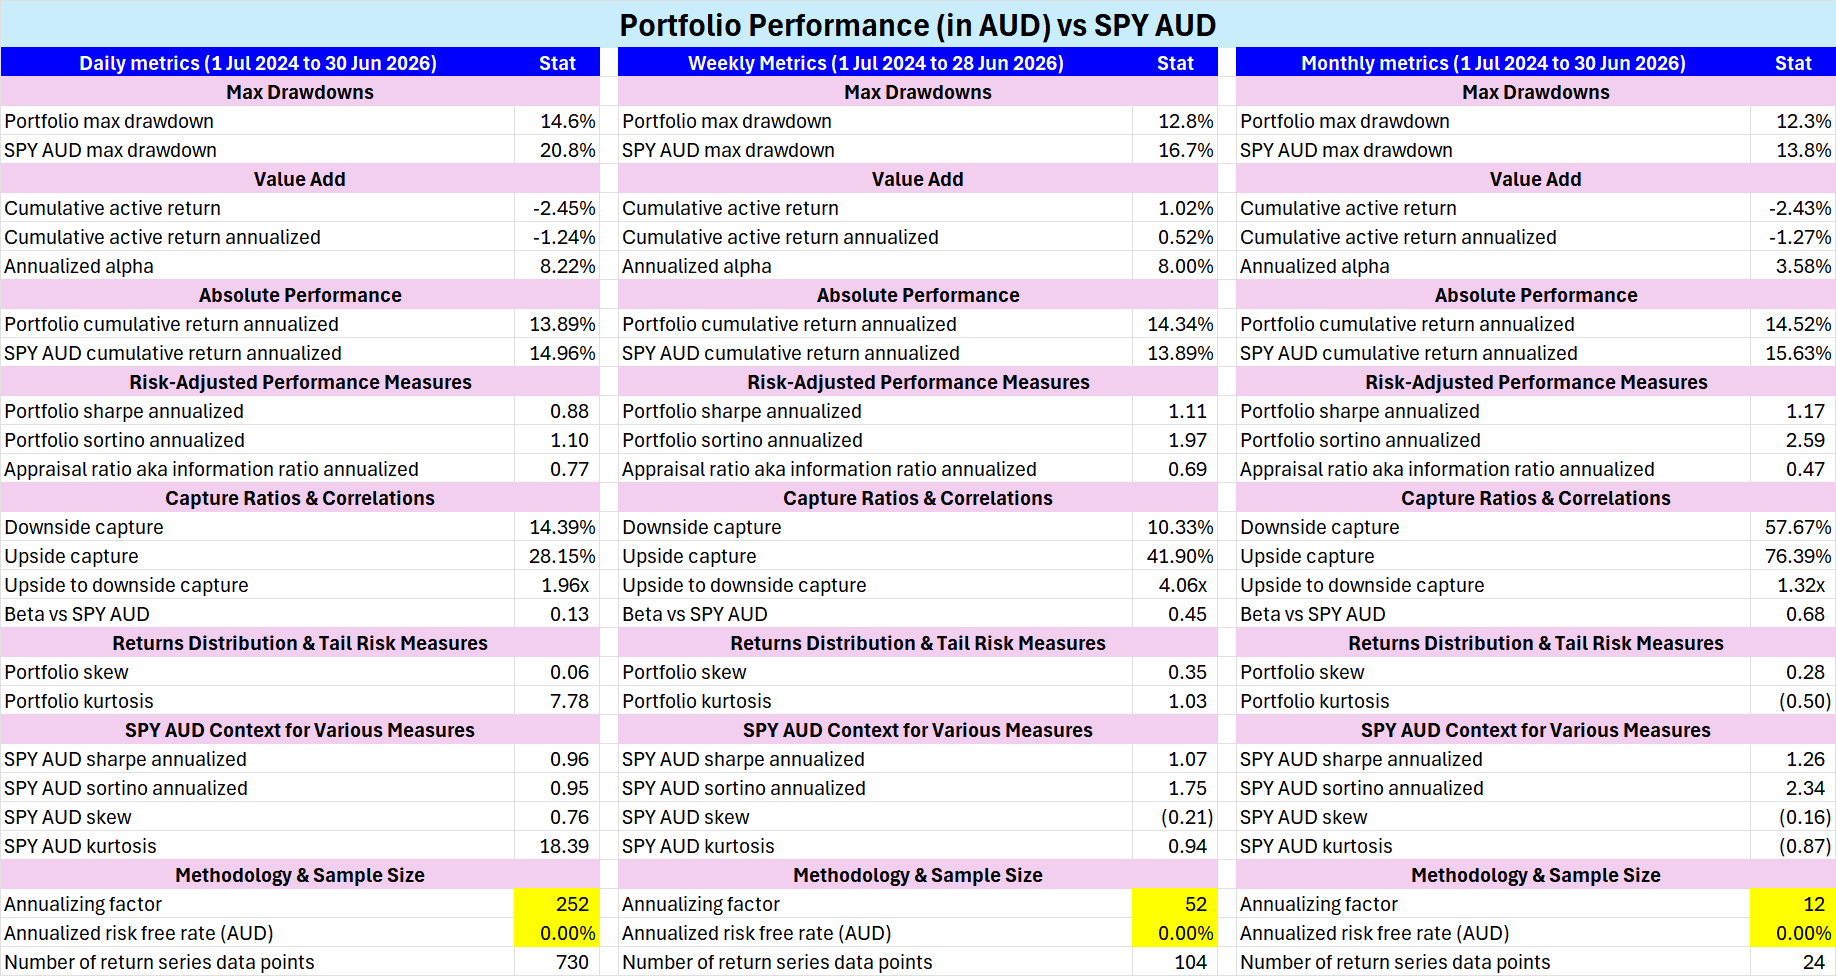
These metrics are computed using an annualized AUD risk-free/hurdle rate of 0%, which is an industry standard for comparability purposes.
- Much lower max drawdowns vs SPY AUD benchmark
- 87% annualized alpha vs SPY AUD benchmark in daily and weekly timeframes
- High upside-to-downside capture, indicating a highly convex (asymmetric) return profile vs SPY AUD.
Active Stock Pick Selection Analytics

- Overall win rate averages are in the low 40%, but average win is almost 2x average loss, leading to a profit factor of 1.4-1.6.
More Details on Portfolio Performance Profile
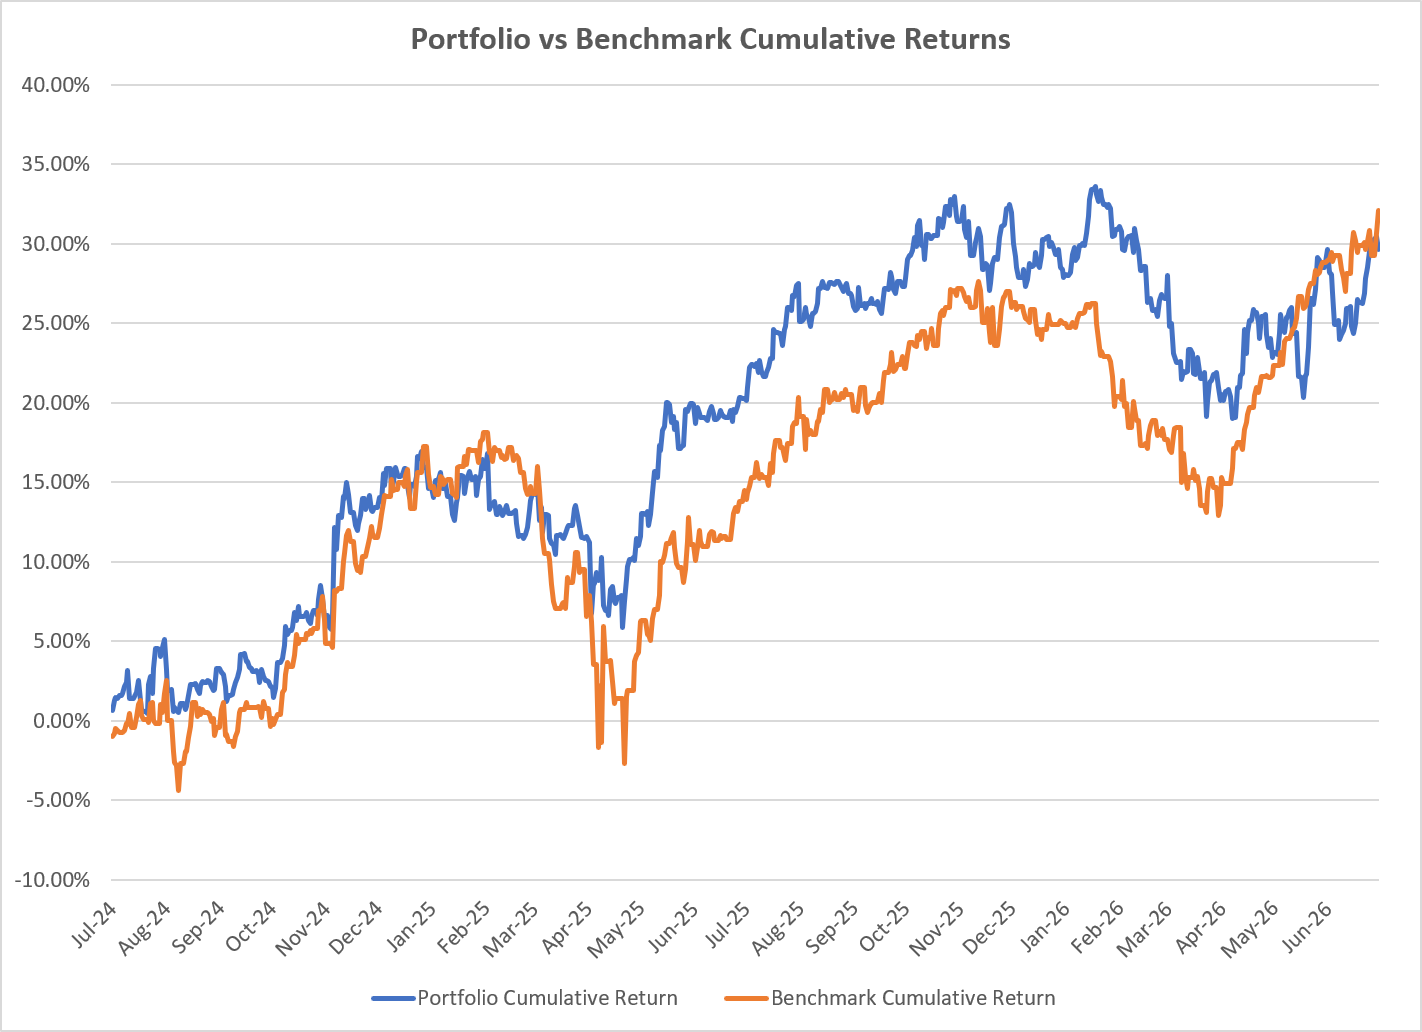
- Mostly sustained outperformance
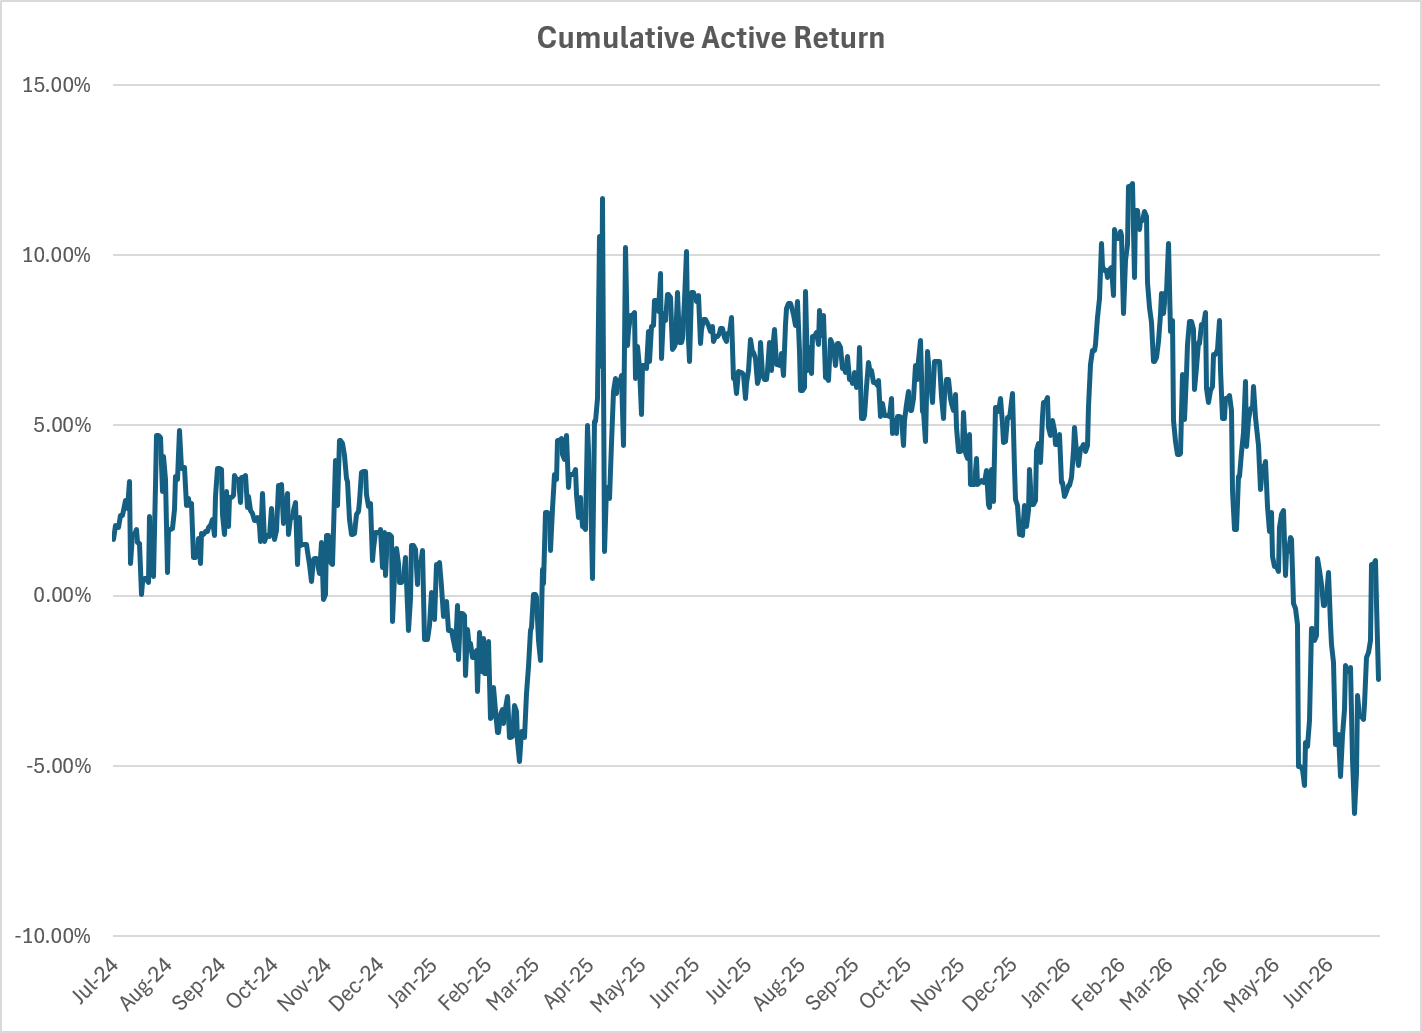
- Lagging the market rebound in 2026 has reduced active return gains
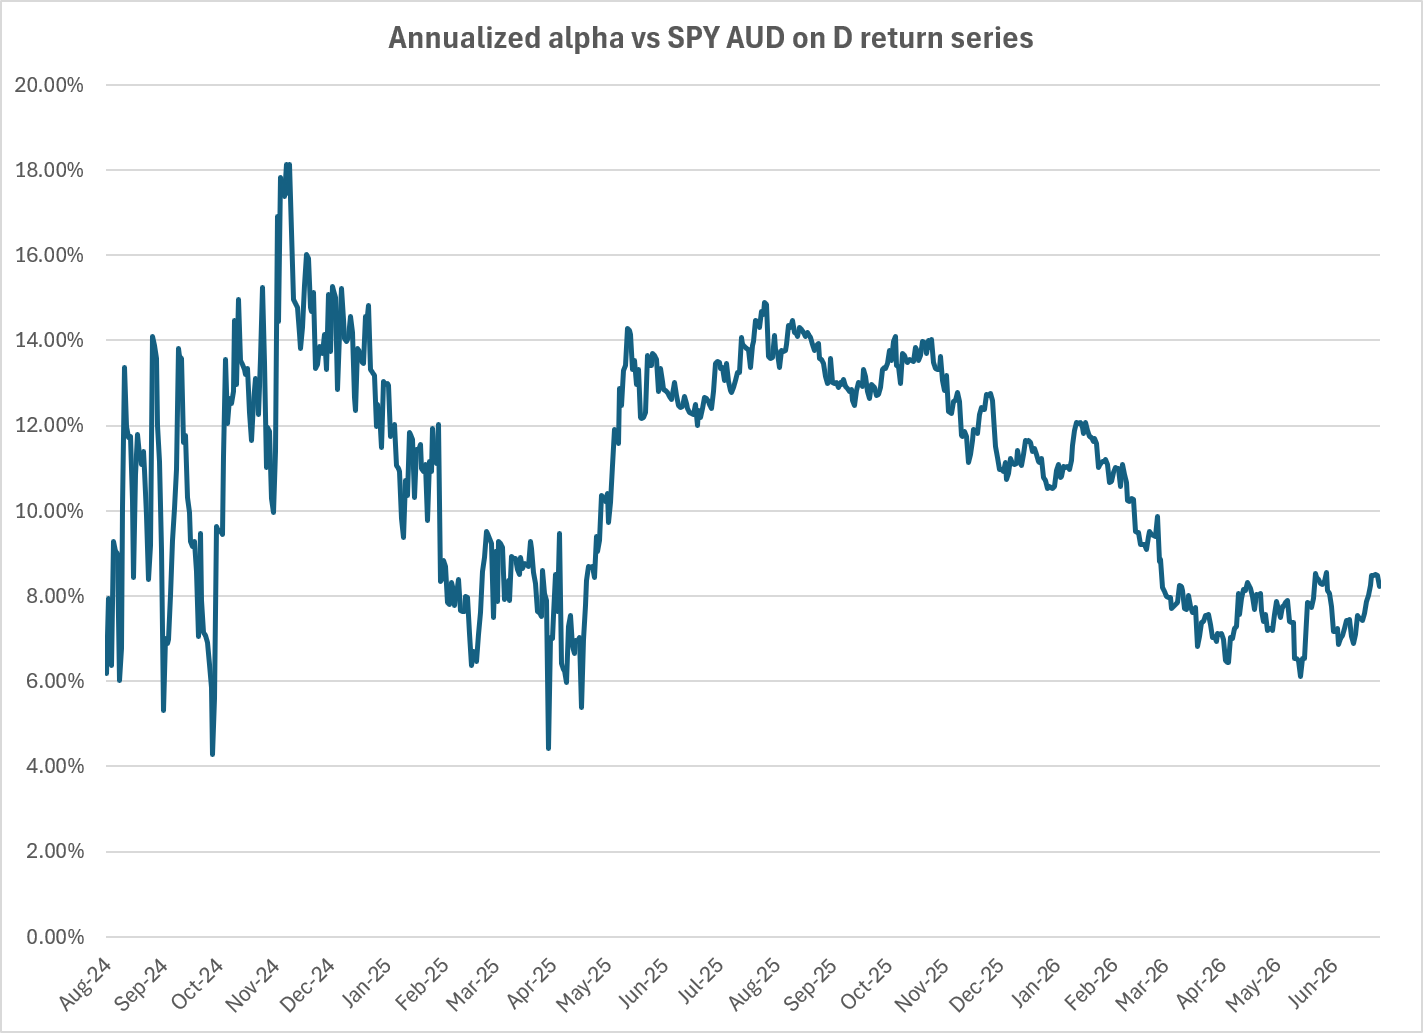
- But from a risk-adjusted performance perspective, the annualized alpha based on daily return series is still very good at around 8%. It has consistently tracked above 4%.
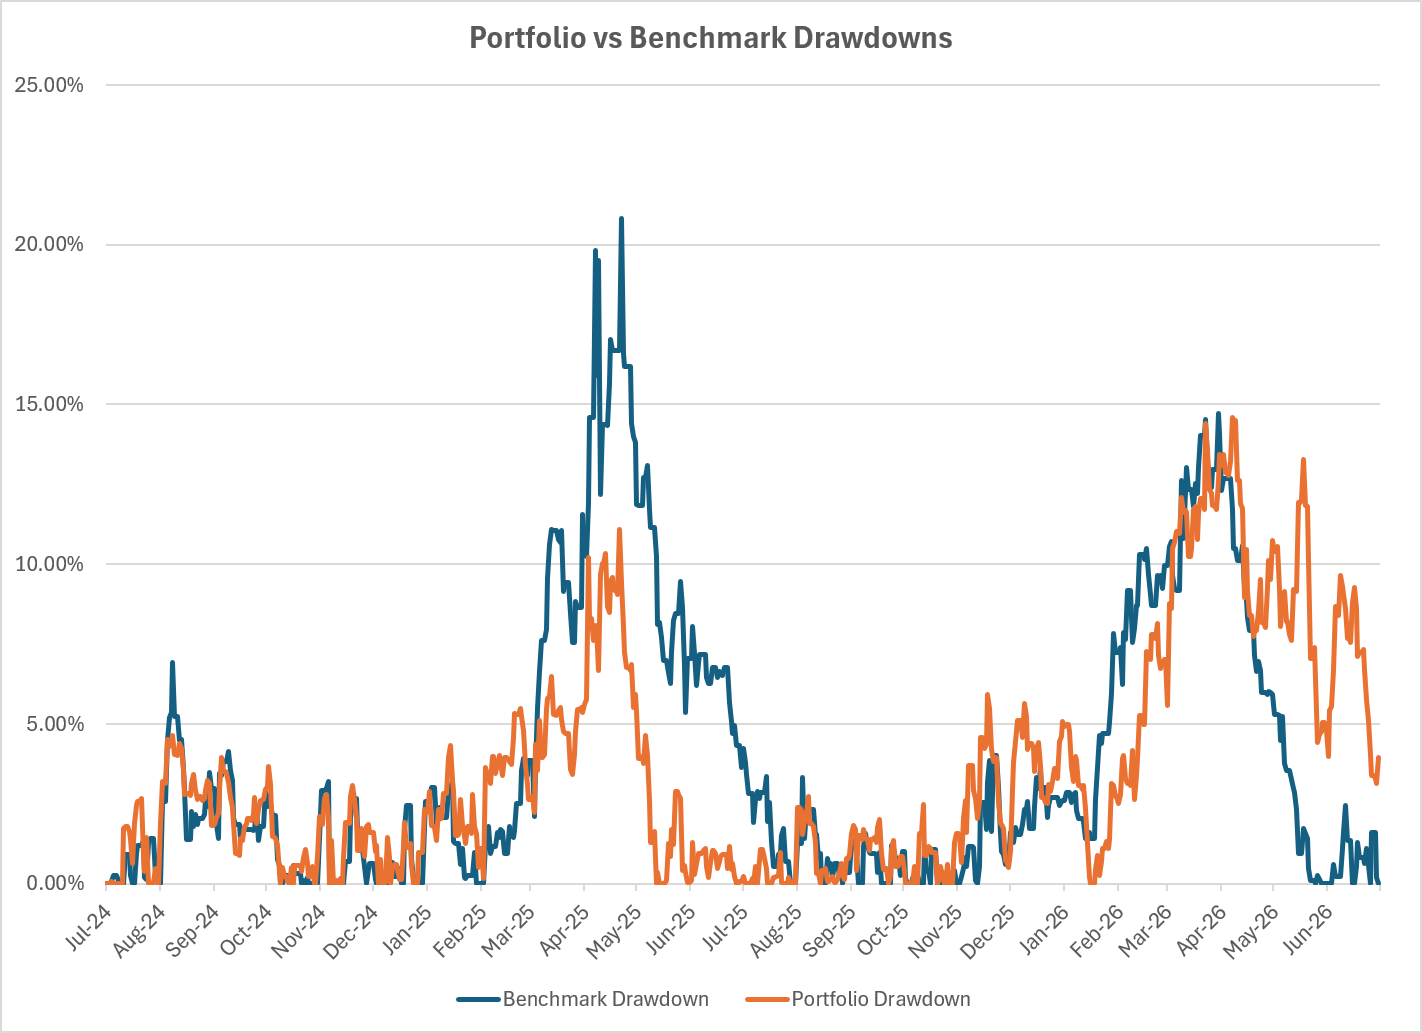
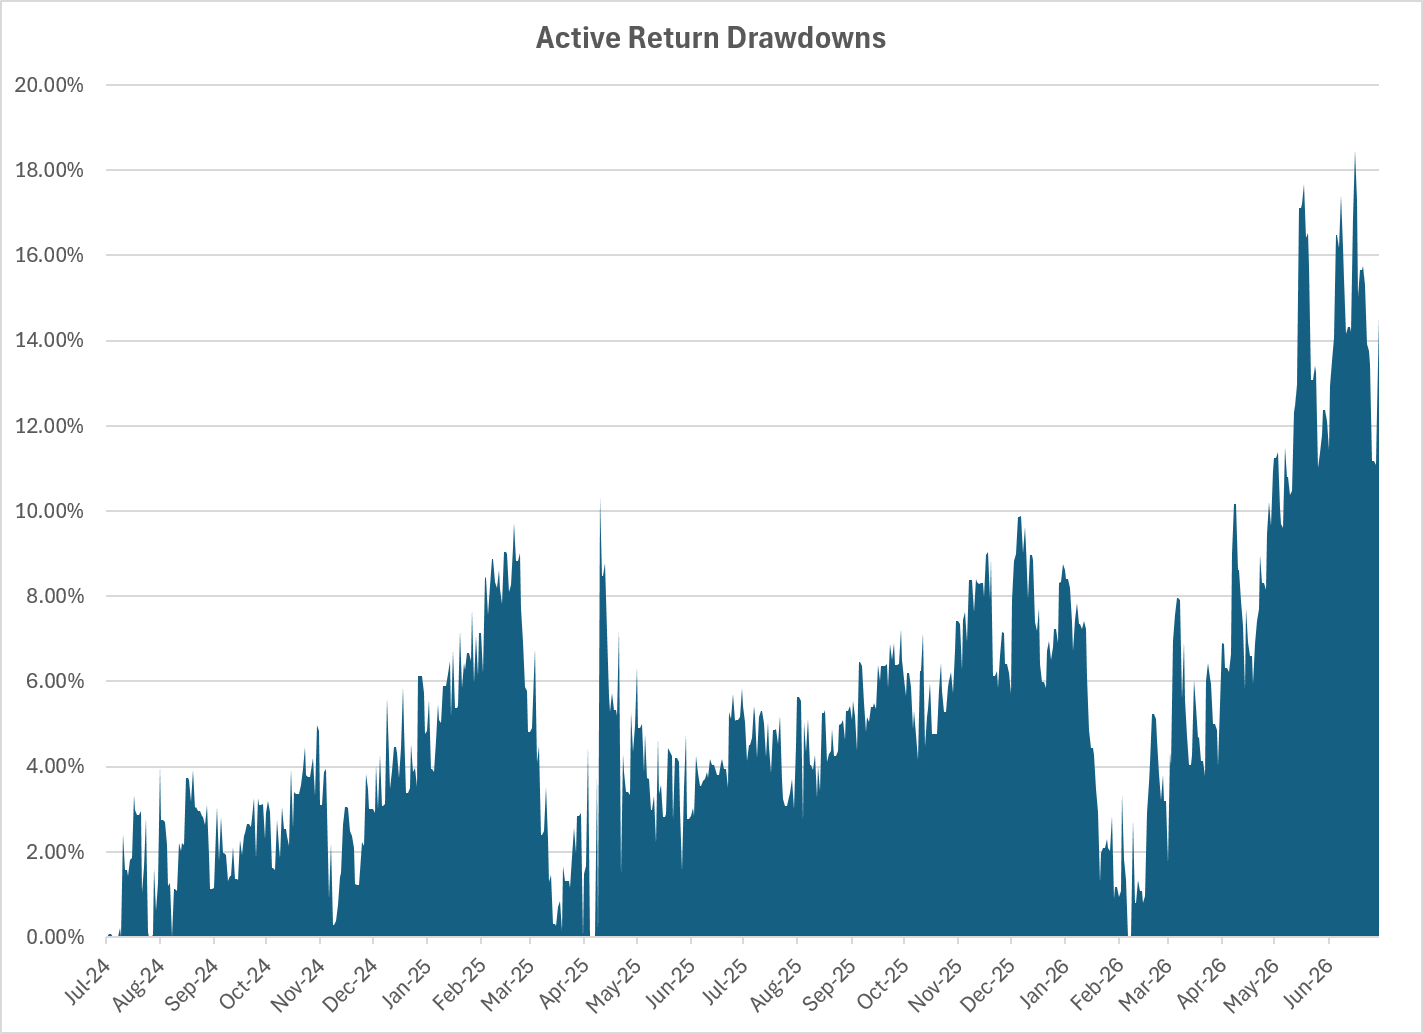
- Active return drawdowns has climbed up to >10.00%.
Takeaway
These are strong risk‑adjusted results for a diversified, long‑only equity strategy by typical institutional benchmarks.
Disclosures and Disclaimers
Past performance ≠ future results. Not investment advice. See full Disclaimer.

Comments ()