Portfolio Performance - Mar'26
Mar'26: ~8% annualized alpha, Sortino 1.8, IR 0.75, rare factor exposures style, low drawdowns. Strategy scalable to >$100M AUM. Live real-money.

Portfolio context is detailed in the About page.
Performance metrics here are for the 1 Jul'24 to 31 Mar'26 time period.
Summary
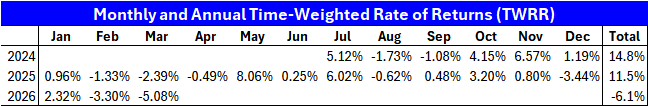
Monthly performance dashboard
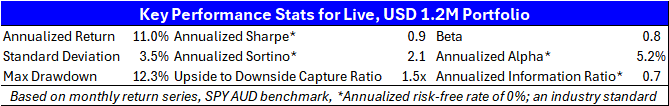
Strong risk-adjusted performance metrics
- Daily/weekly Sharpe: 0.73/1.00, assuming 0% risk-free or hurdle rate.
- Daily/weekly Sortino: 0.90/1.79, assuming 0% risk-free or hurdle rate.
- Daily/weekly annualized alpha: of 7%/8% vs SPY AUD benchmark.
Value addition measures are high.
Results are based on a very large, diverse sample size
- Almost 1,300 tickers bet on over 21 months.
- Return contributions are broad-based across market caps, sectors and industries.
- Aggregate returns profile is made up of many contributions of small positions rather than a reliance on a few concentrated winners.
Diverse sources of returns reduces dependency on favorable market regimes.
Minimal catastrophic tail risk and scalable
- Long-only, zero leverage strategy investing in global stocks and related traditional ETFs without any inverse, ETN or other derivative exposures in mostly Developed markets.
- Positive skew in both overall portfolio and ticker-level return, contribution to return distributions.
- Low max drawdowns, low beta, upside to downside capture ratio of 1.5-2.5x.
- Market impact analysis suggests this portfolio is largely scalable to >USD 100M AUM.
The strategy is suitable to manage a large amount of capital in order to grow wealth over a long period of time with dramatically reduced volatility along the way.
Performance vs SPY AUD, Developed 5 Factor + Developed Momentum Factors
Portfolio (AUD) vs SPY AUD
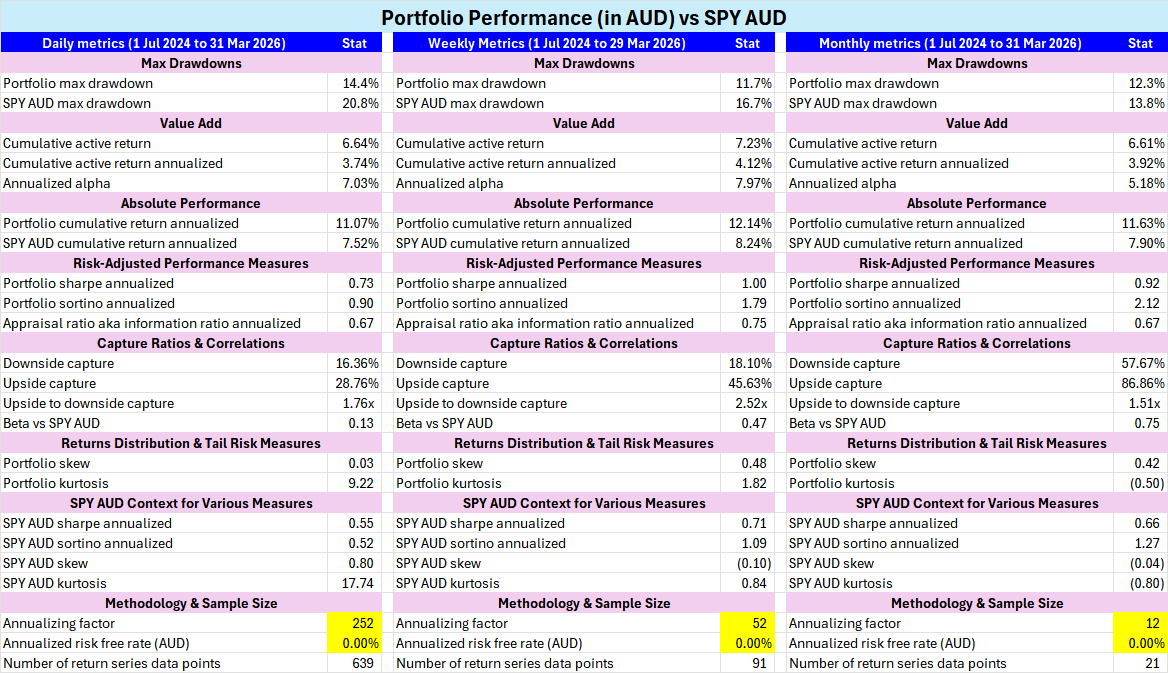
These metrics are computed using an annualized AUD risk-free/hurdle rate of 0%, which is an industry standard for comparability purposes.
- Much lower max drawdowns vs SPY AUD benchmark
- >5% annualized alpha vs SPY AUD benchmark
- >1.5x upside-to-downside capture, indicating a highly convex (asymmetric) return profile vs SPY AUD.
Portfolio vs Developed 5 Factor + Developed Momentum Factor Regressions
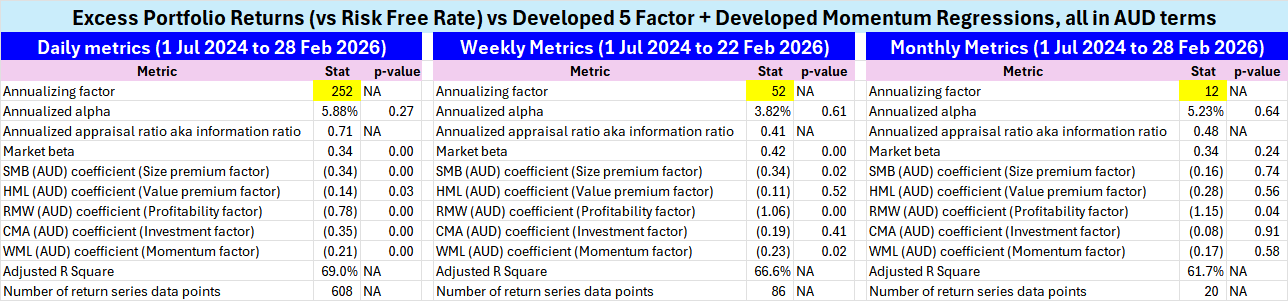
- Positive but not statistically significant (p-val > 0.1) alpha for now.
- Low-beta strategy (statistical significance across daily and weekly regressions)
- Negative coefficient tilt to all Developed 5 Factor + Developed Momentum Factors (statistical significance for Profitability factor across all regressions, Size and Momentum factor in daily and weekly regressions, Value and Investment factor in daily regressions)
- Combination of negative coefficient tilt to Fama French Developed 5 Factors + Developed Momentum factors and low-beta makes for a rare factor exposure style
Contribution to Return (CTR) Analytics
Overview
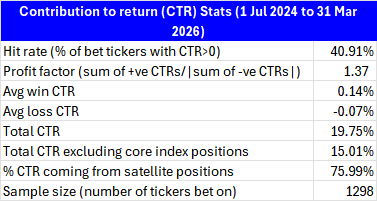
- Most of the CTR comes from active satellite picks, not core index exposure positions
- A huge, almost 1,300 sample size of ticker bets increases robustness of the strategy's performance stats
CTR, Return and Average Weight Distributions
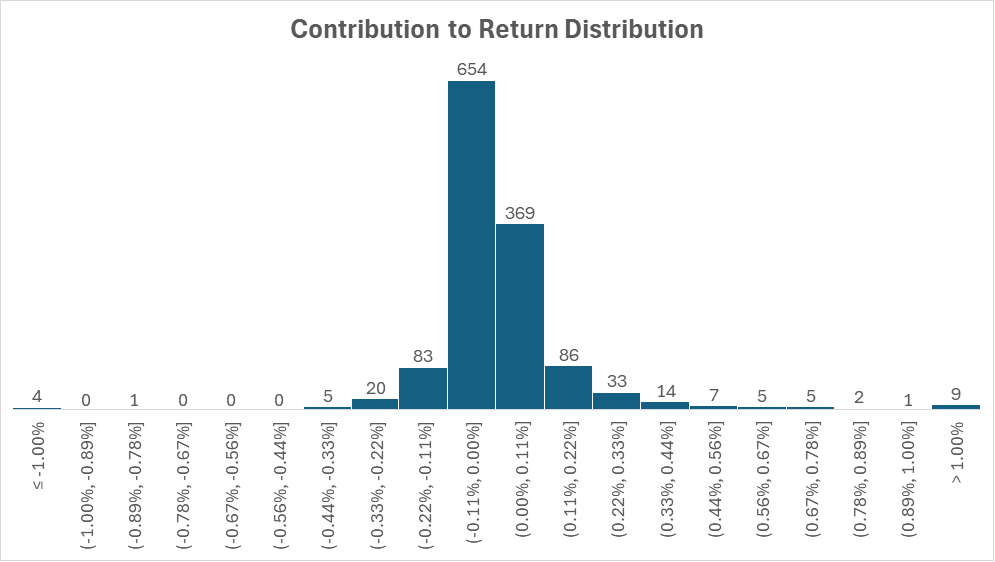
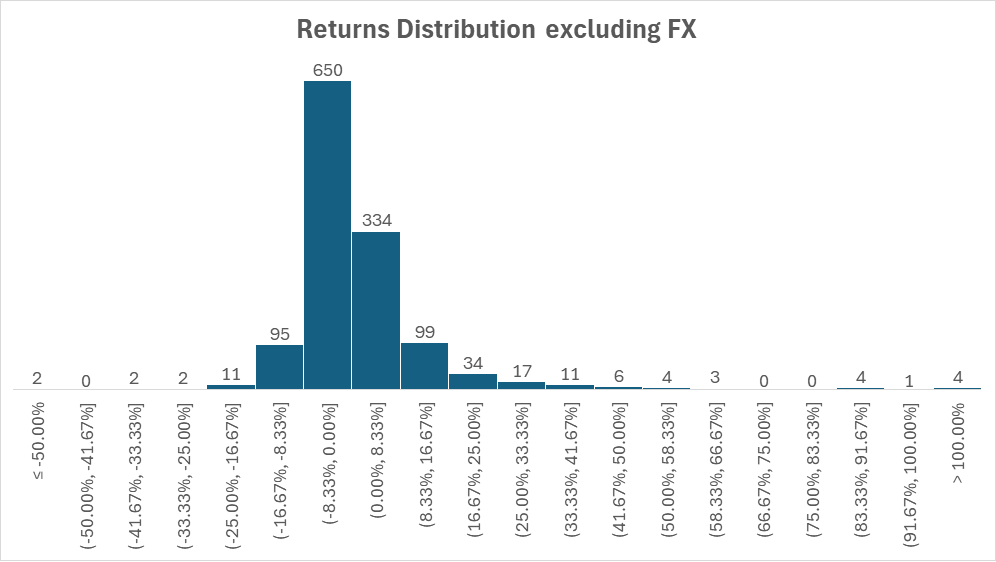
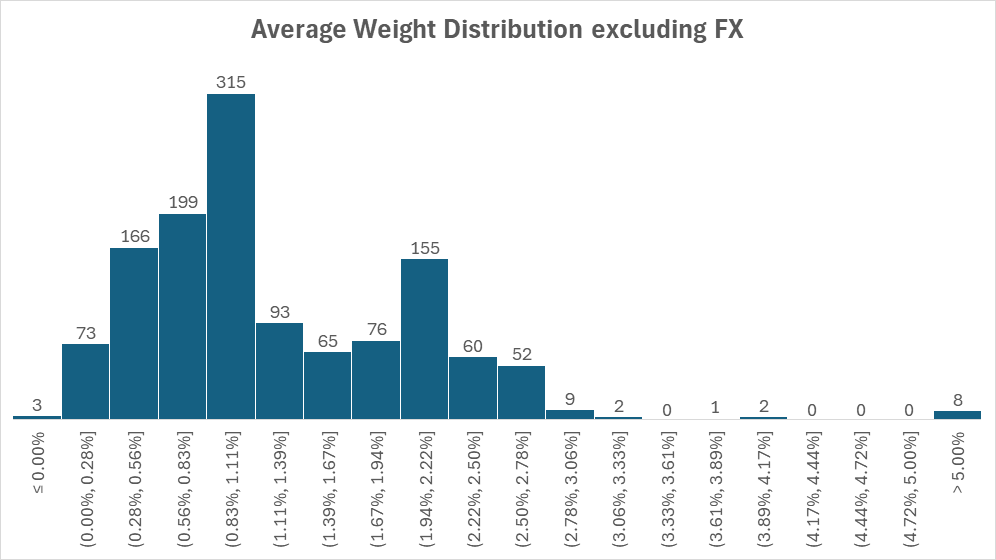
- Histograms show that return contributions have a clear positive skew and is comprised of the aggregate of many small bets rather than a small number of outsized winners.
Sector and Industry CTR Drivers
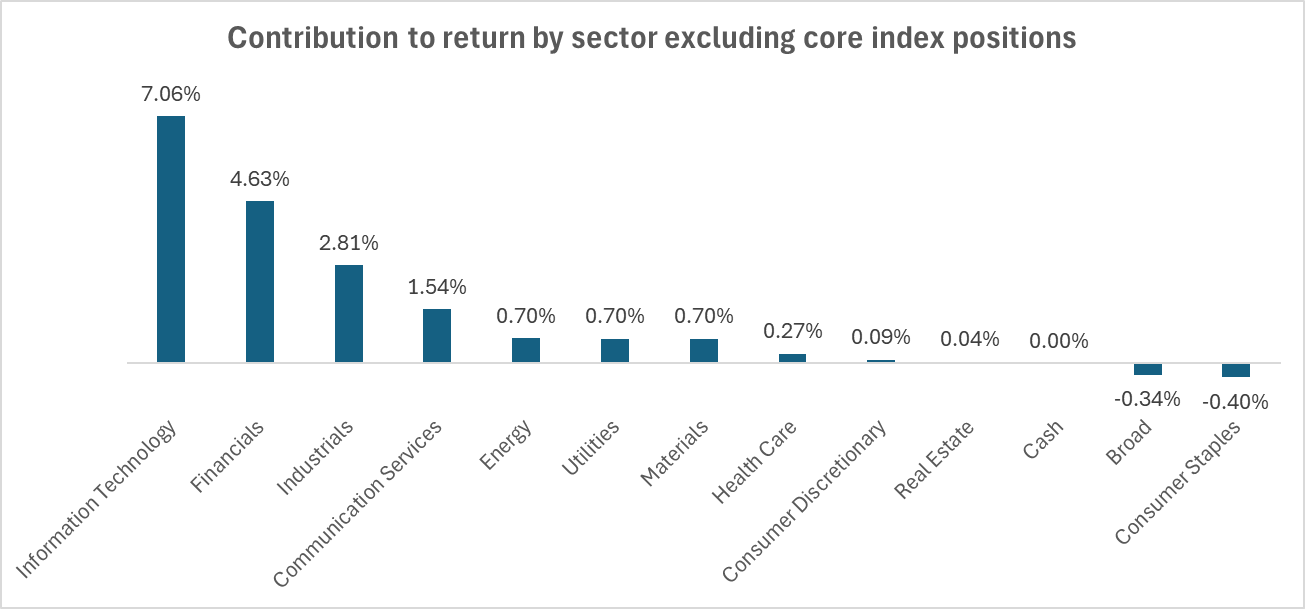
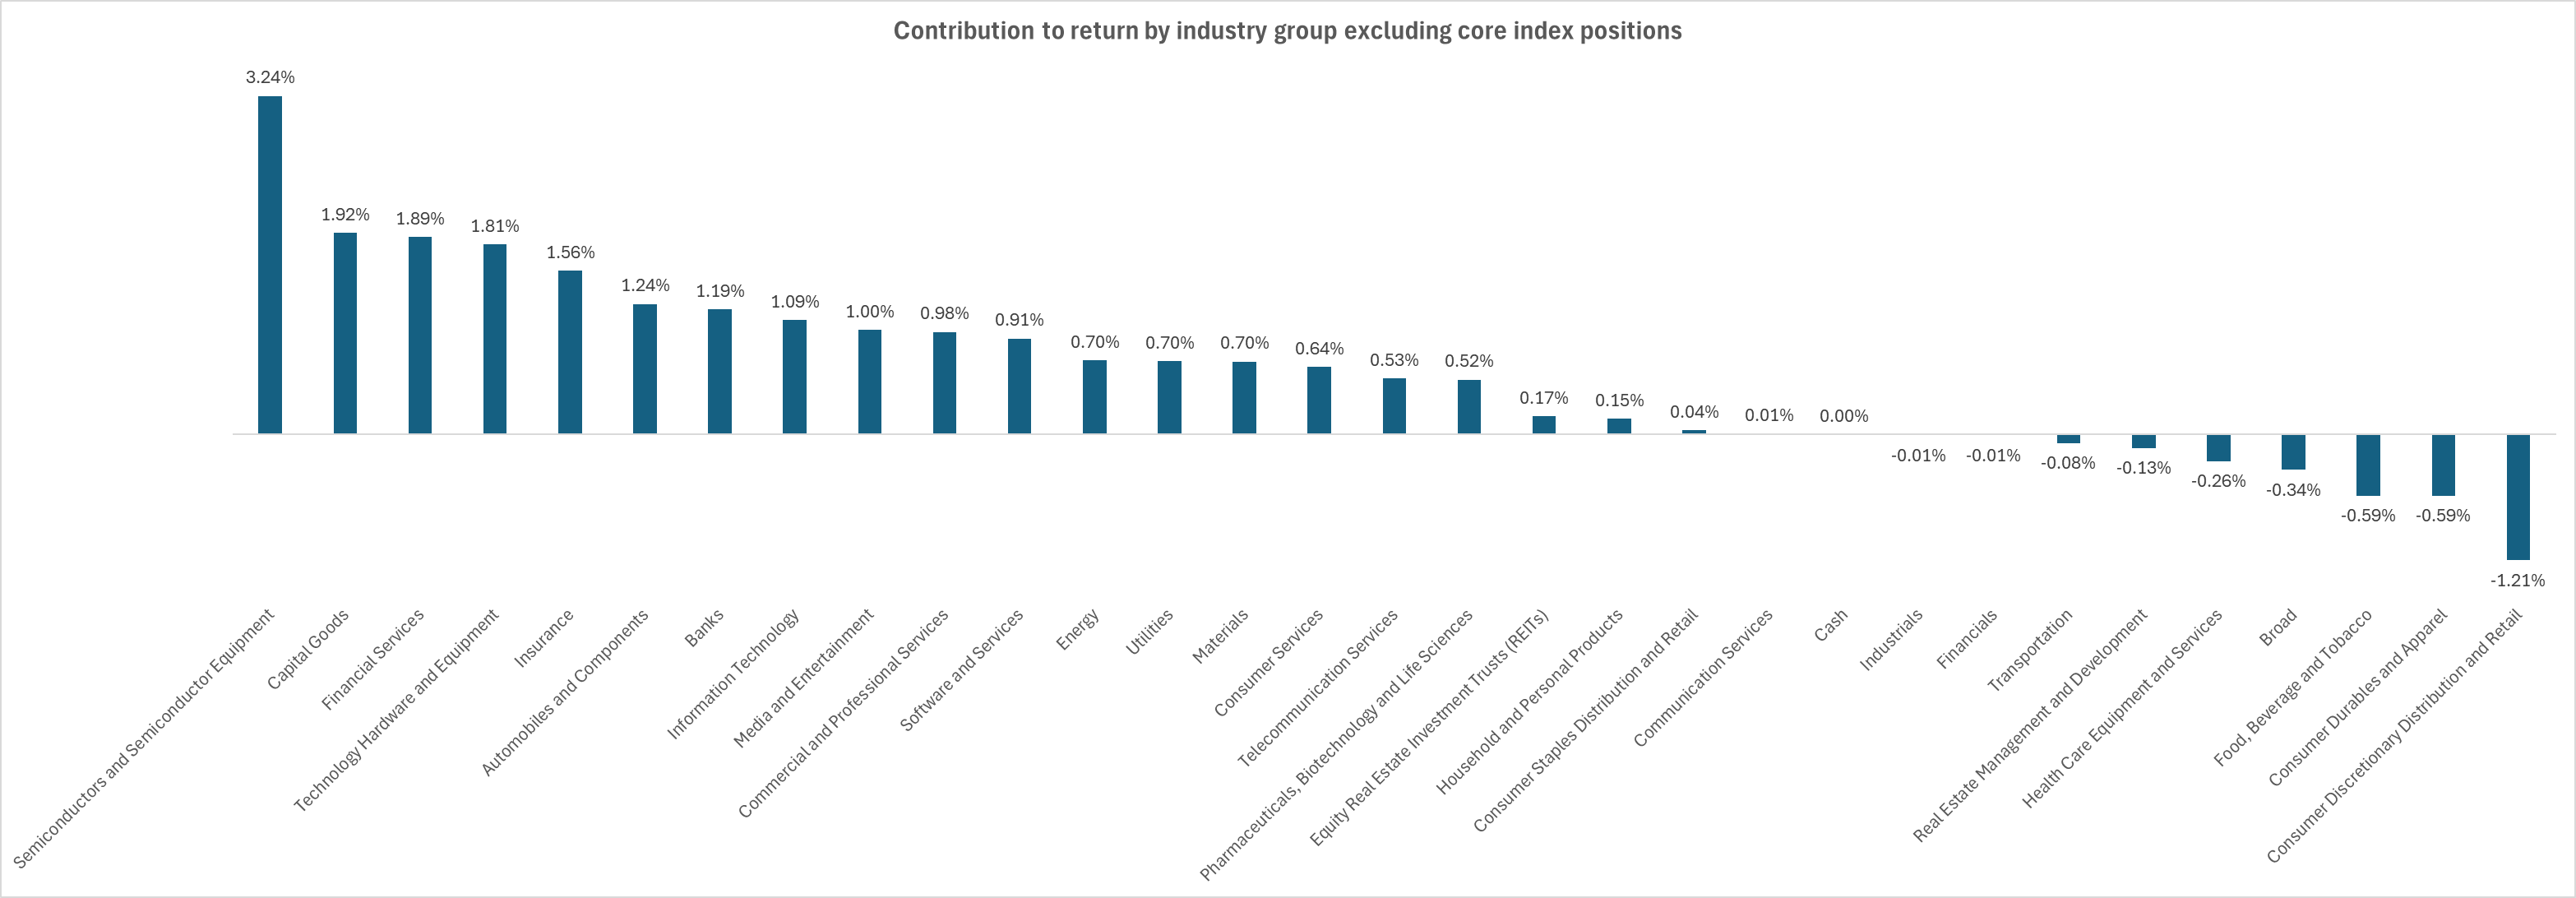
- CTRs of satellite picks are broad-based across sectors and industries
Analysis of scalability; MCAP and Market Impact CTRs
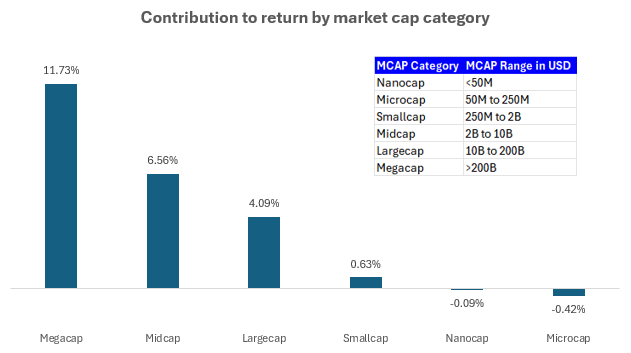
- Minimal return contributions from smallcaps, microcaps and nanocaps.
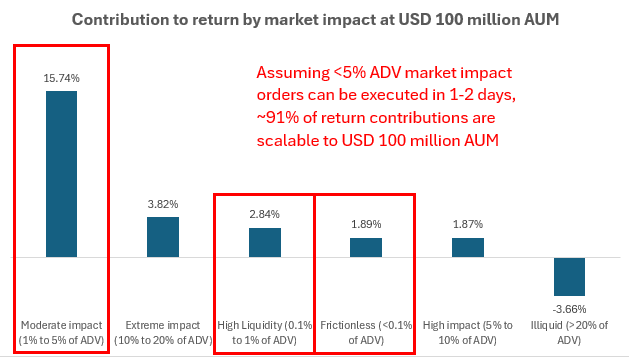
- Under conservative average daily traded value (ADV) assumptions,
91% of return contributions are scalable to USD 100M AUM.
Top Contributors and Detractors
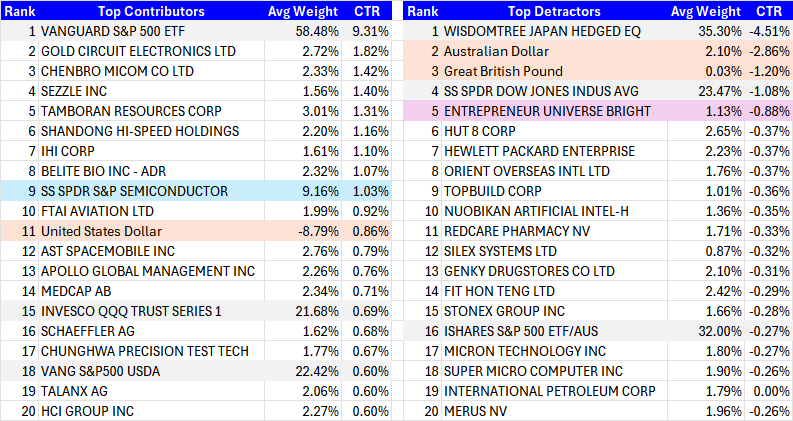
- Top contributors are meaningfully larger than top detractors, showing positive
return skew. - Grey-highlighted names are core index positions.
- Peach-highlighted names are FX movements.
- Blue-highlighted name represents a rare, high conviction satellite position.
- Pink-highlighted name is a rare mistake of investing in a highly illiquid stock.
Active Stock Pick Selection Analytics
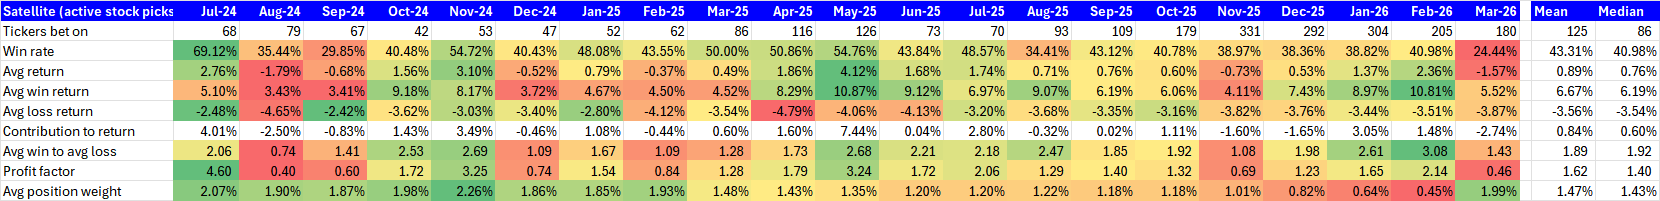
- Overall win rate averages are in the low 40%, but average win is almost 2x average loss, leading to a profit factor of 1.4-1.6.
- Mar'26 was the worst month so far in terms of win rate and the 2nd worst in terms of profit factor.
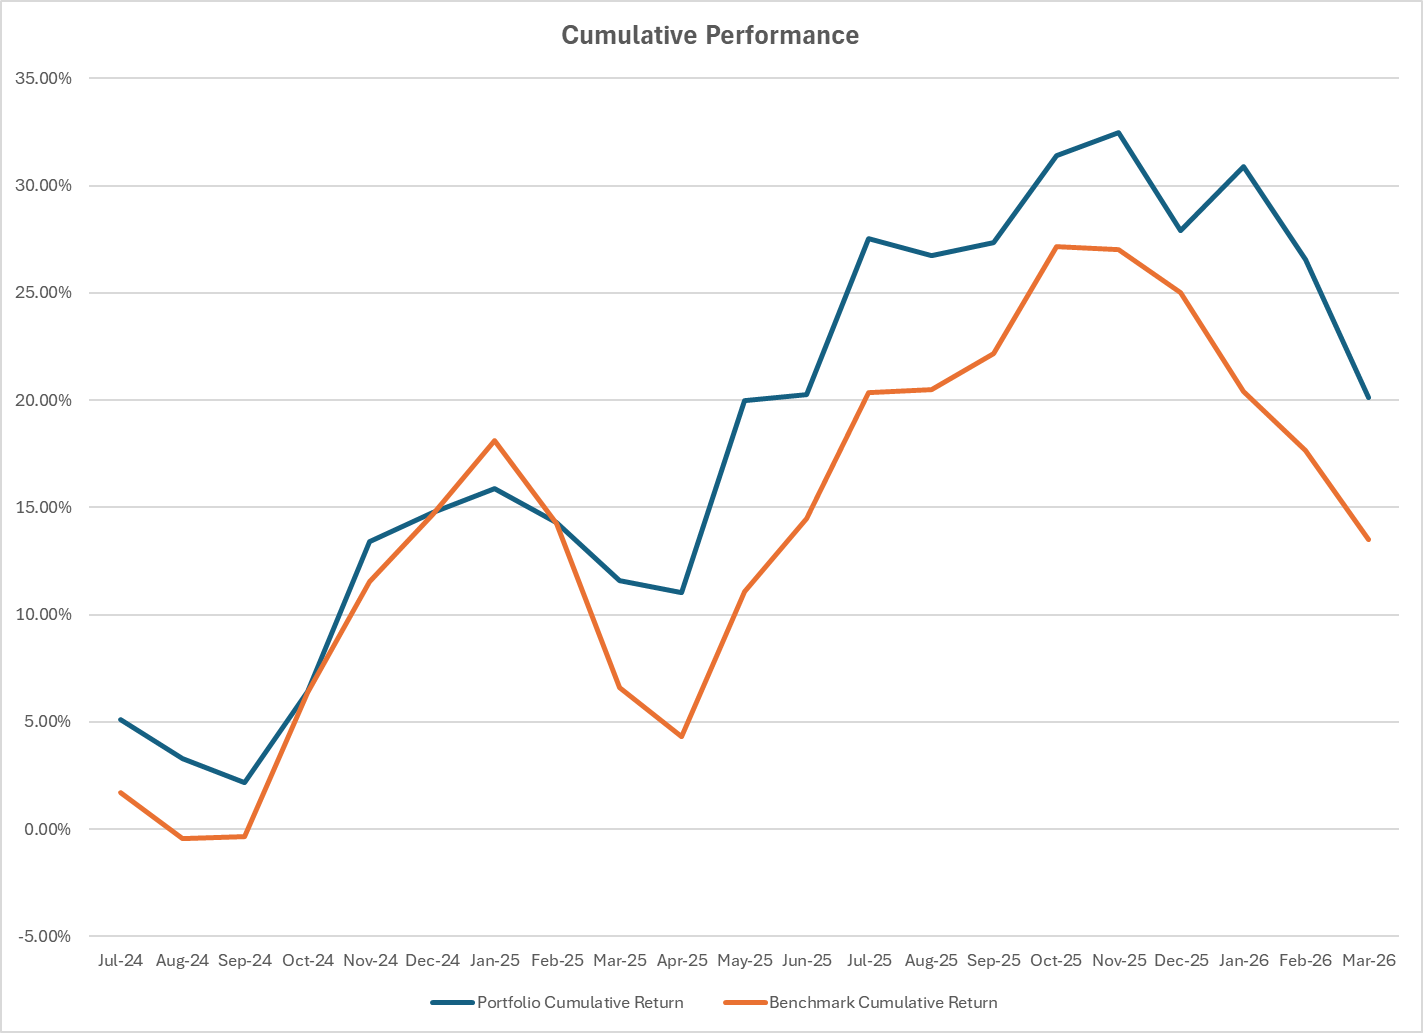
More Details on Portfolio Performance Profile
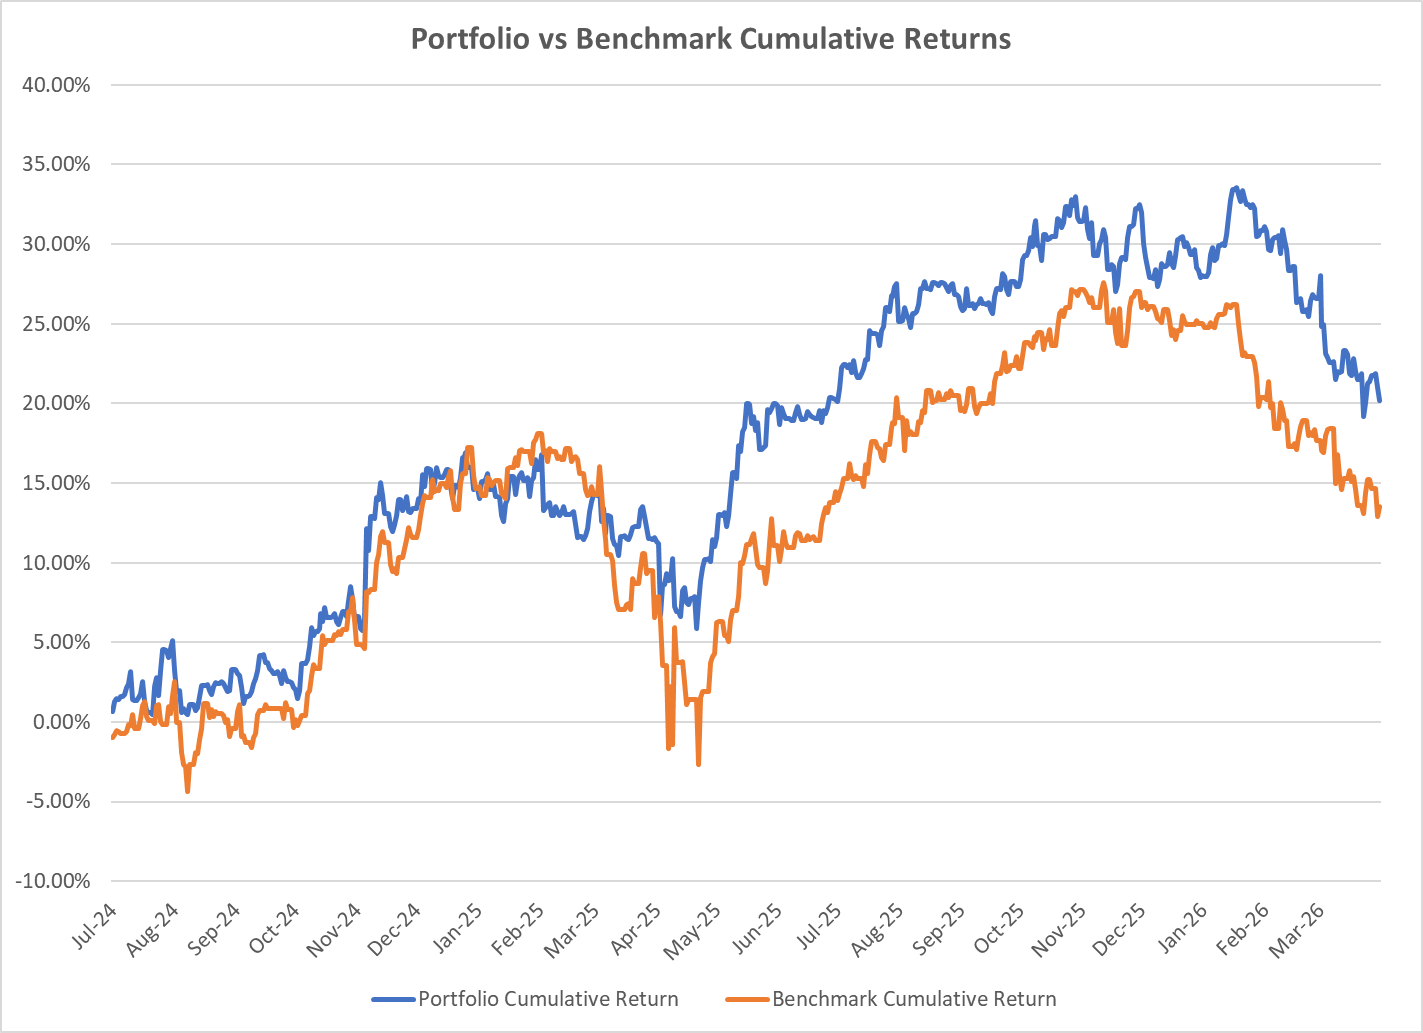
- Sustained outperformance
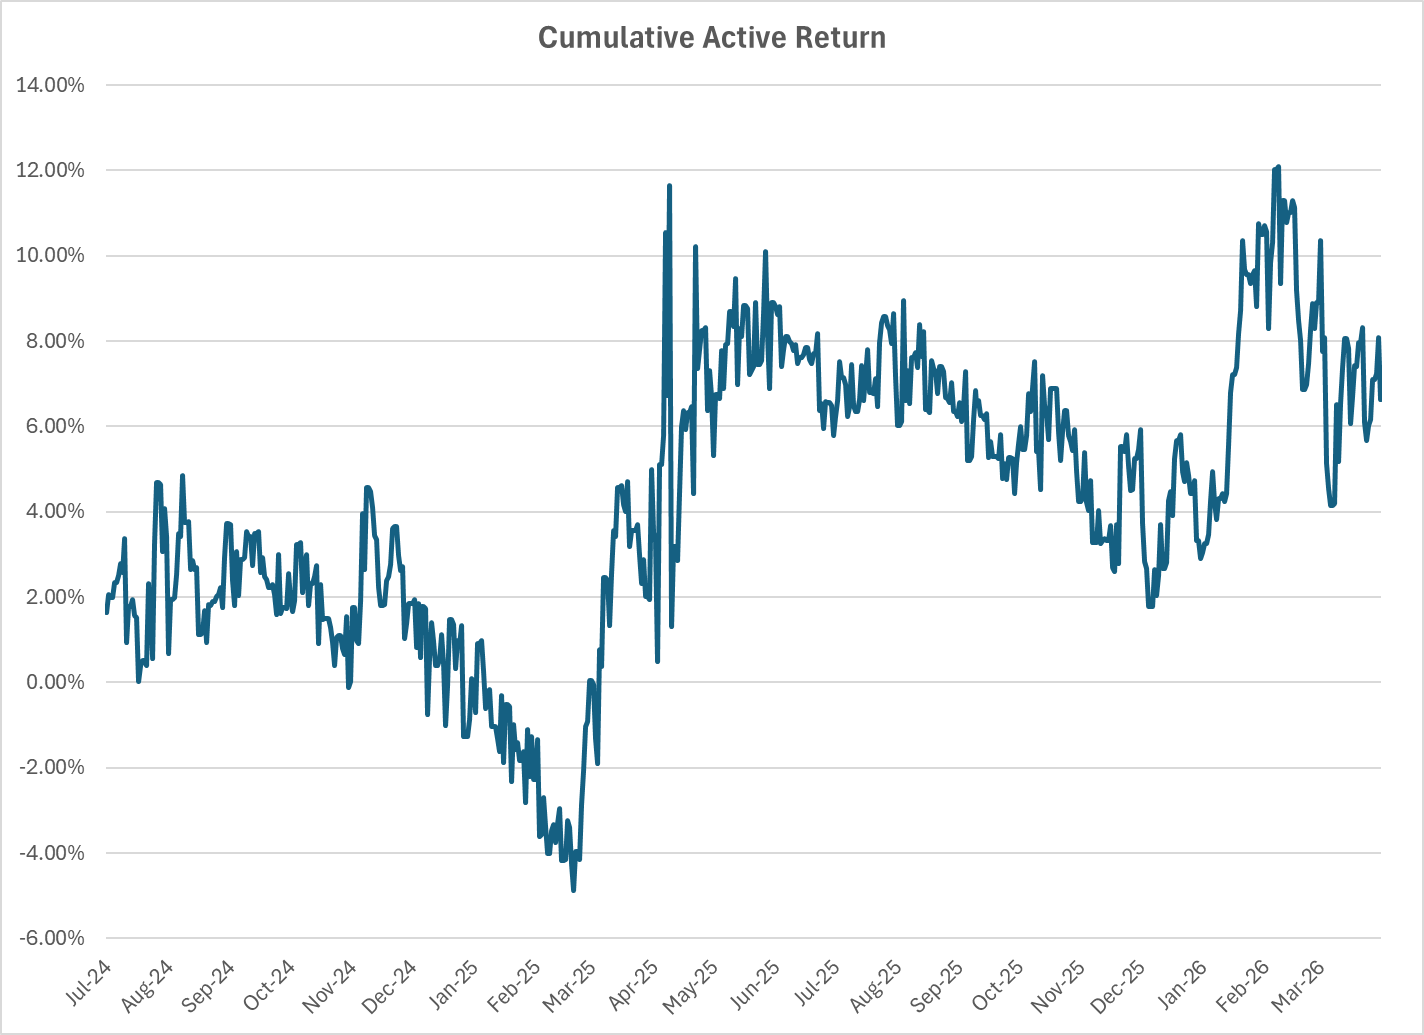
- Positive active return accumulation vs SPY AUD
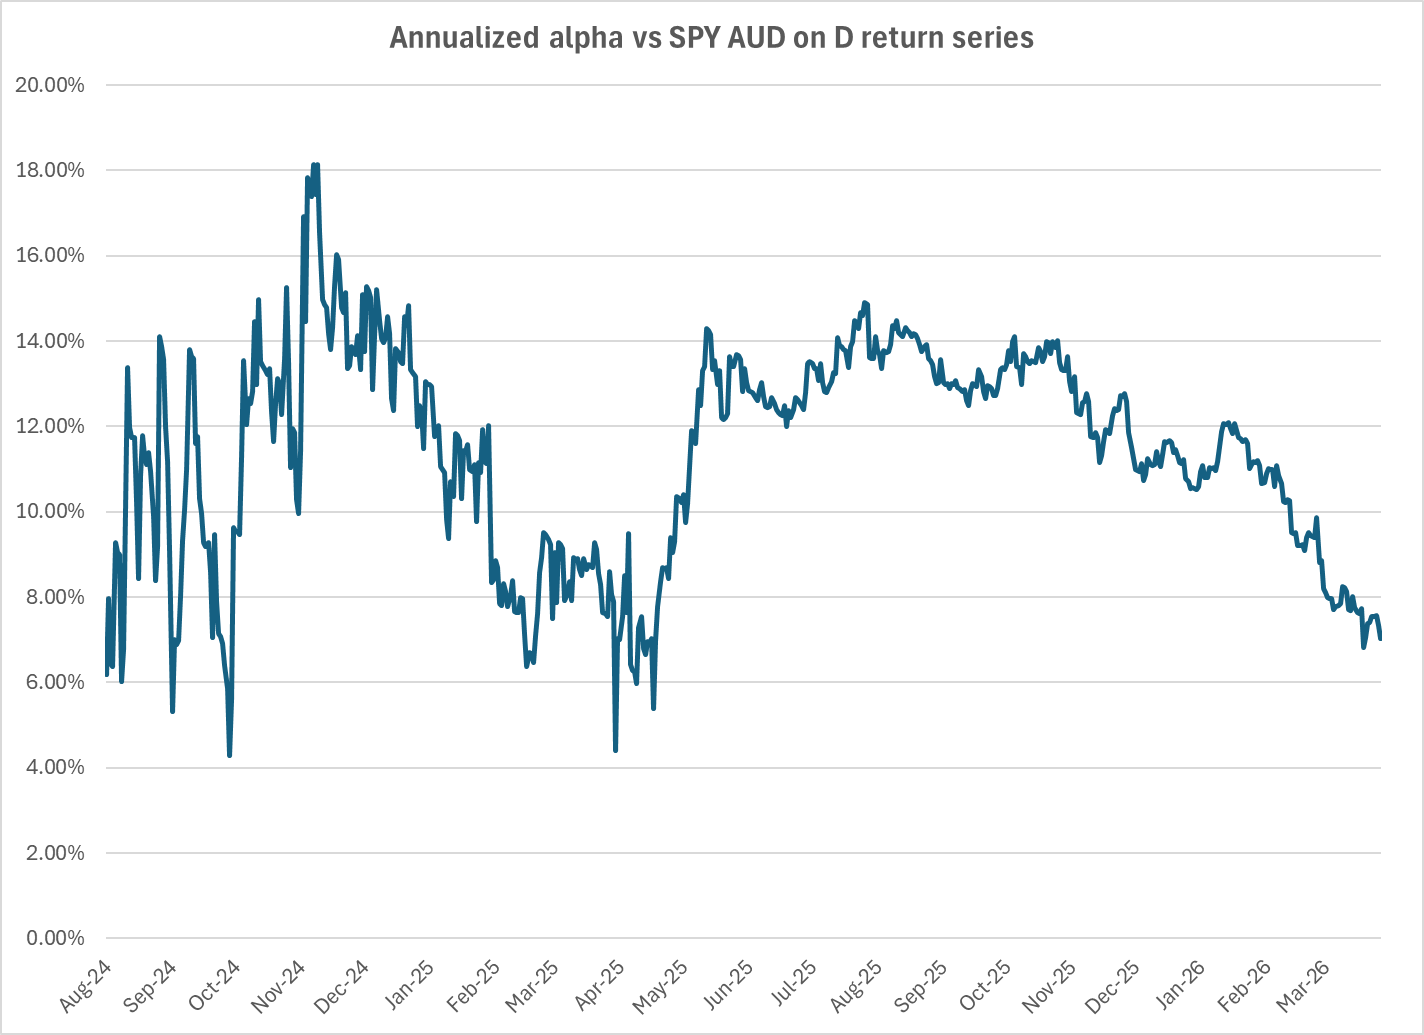
- High-single digit annualized alpha
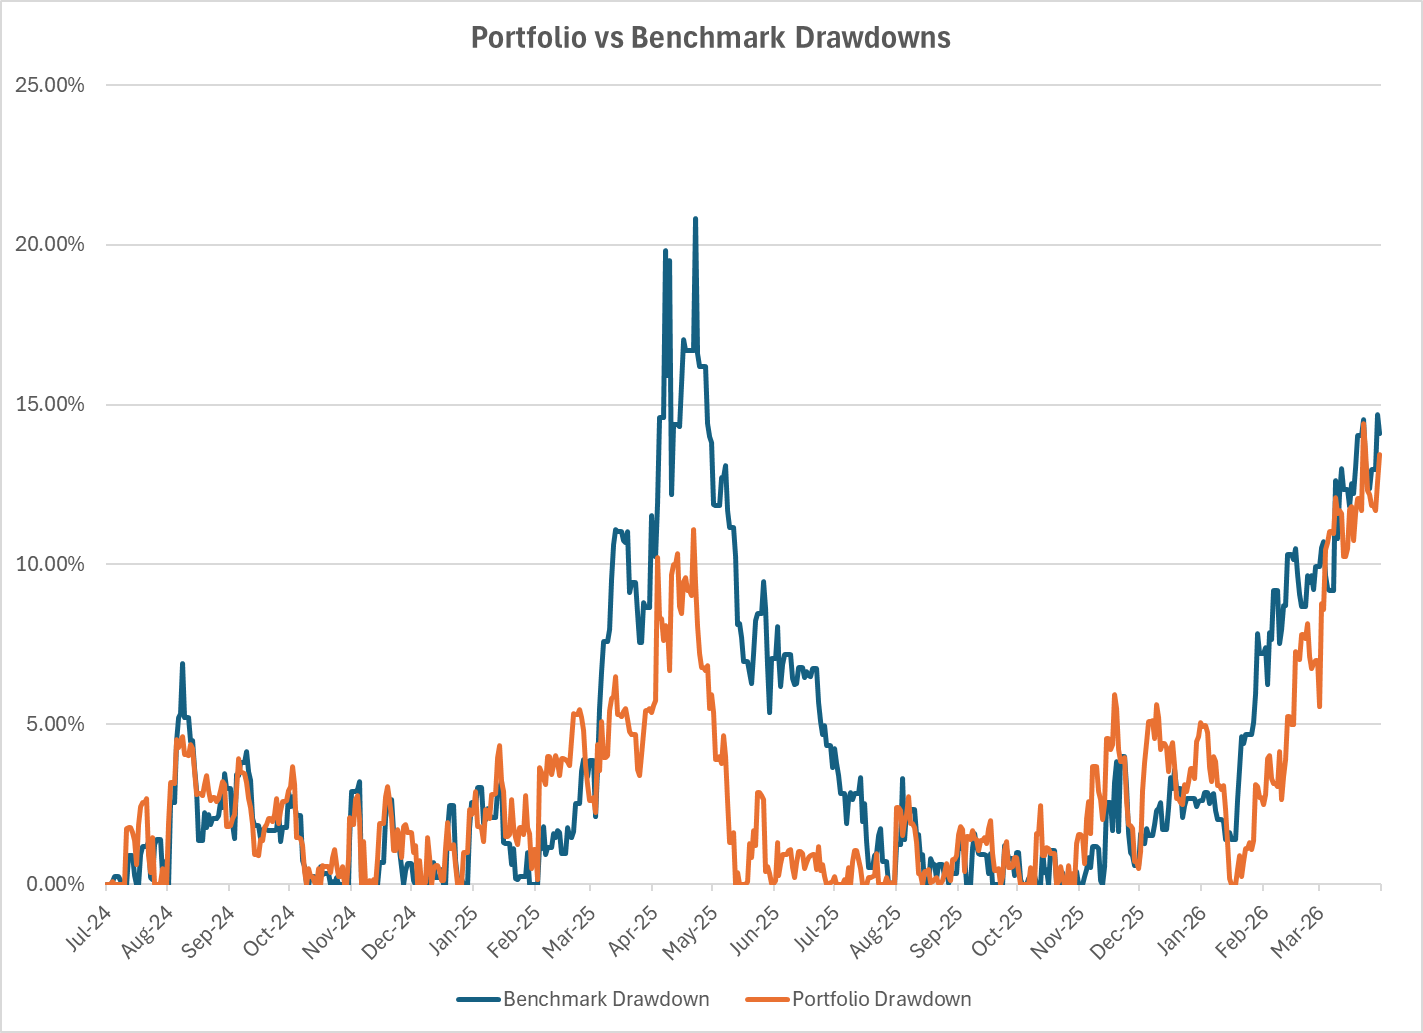
- Much lower drawdown profile vs benchmark
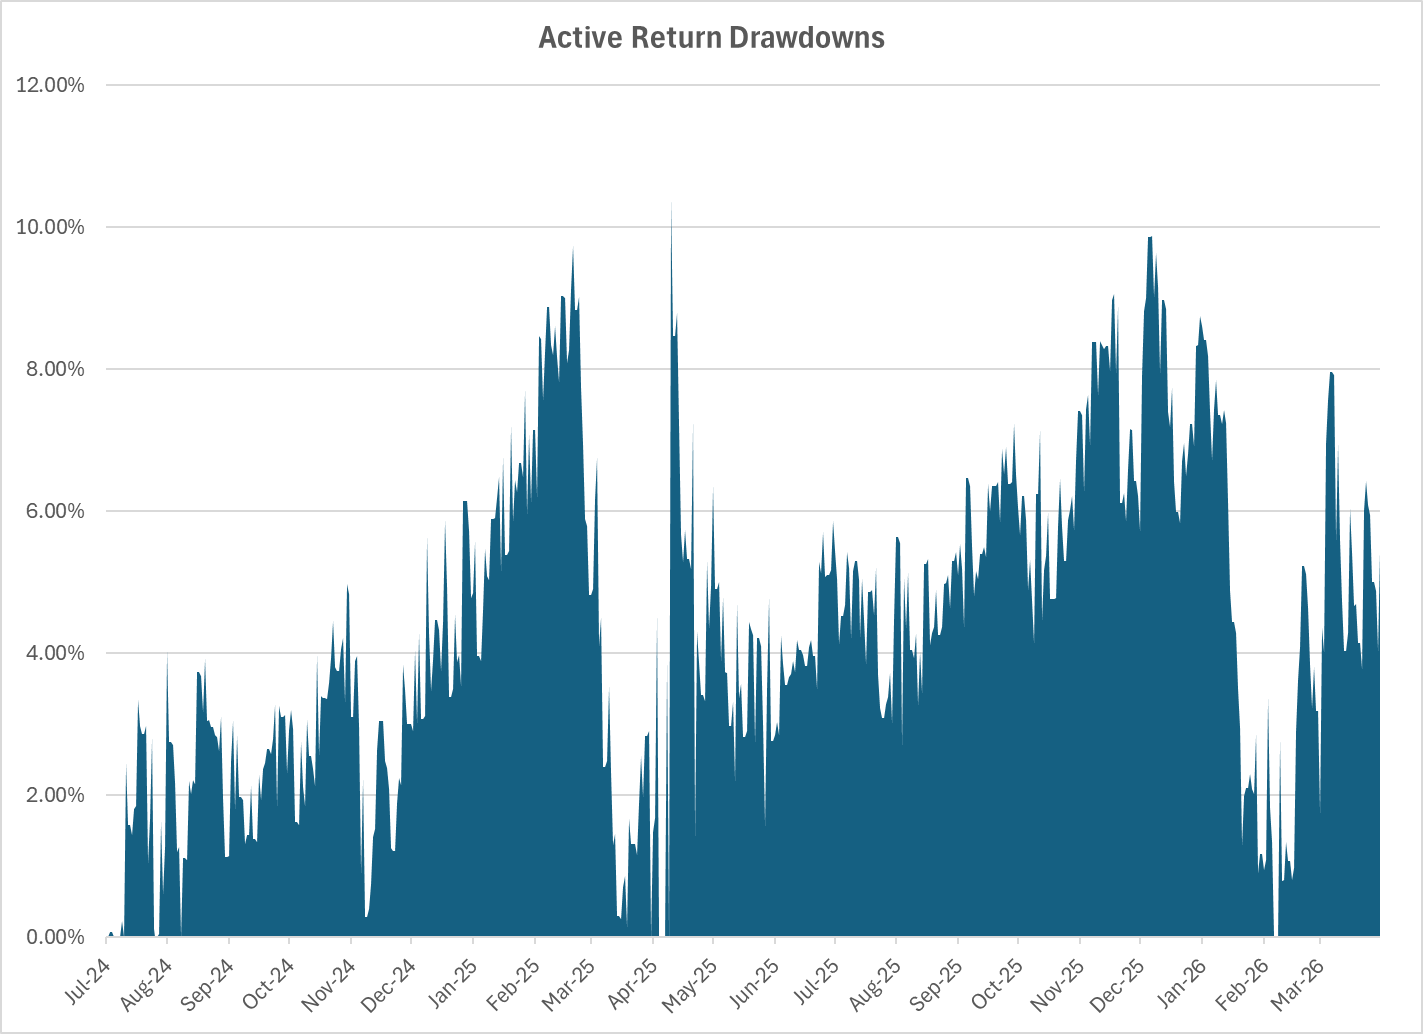
- Lag vs SPY AUD benchmark has been contained to <1000bps
Takeaway
These are strong performance metrics by any institutional standard.
Disclosures and Disclaimers
Past performance ≠ future results. Not investment advice. See full Disclaimer.
Comments ()